11. Outcomes and meta-analysis
To pool the included studies' results, open Outcomes.
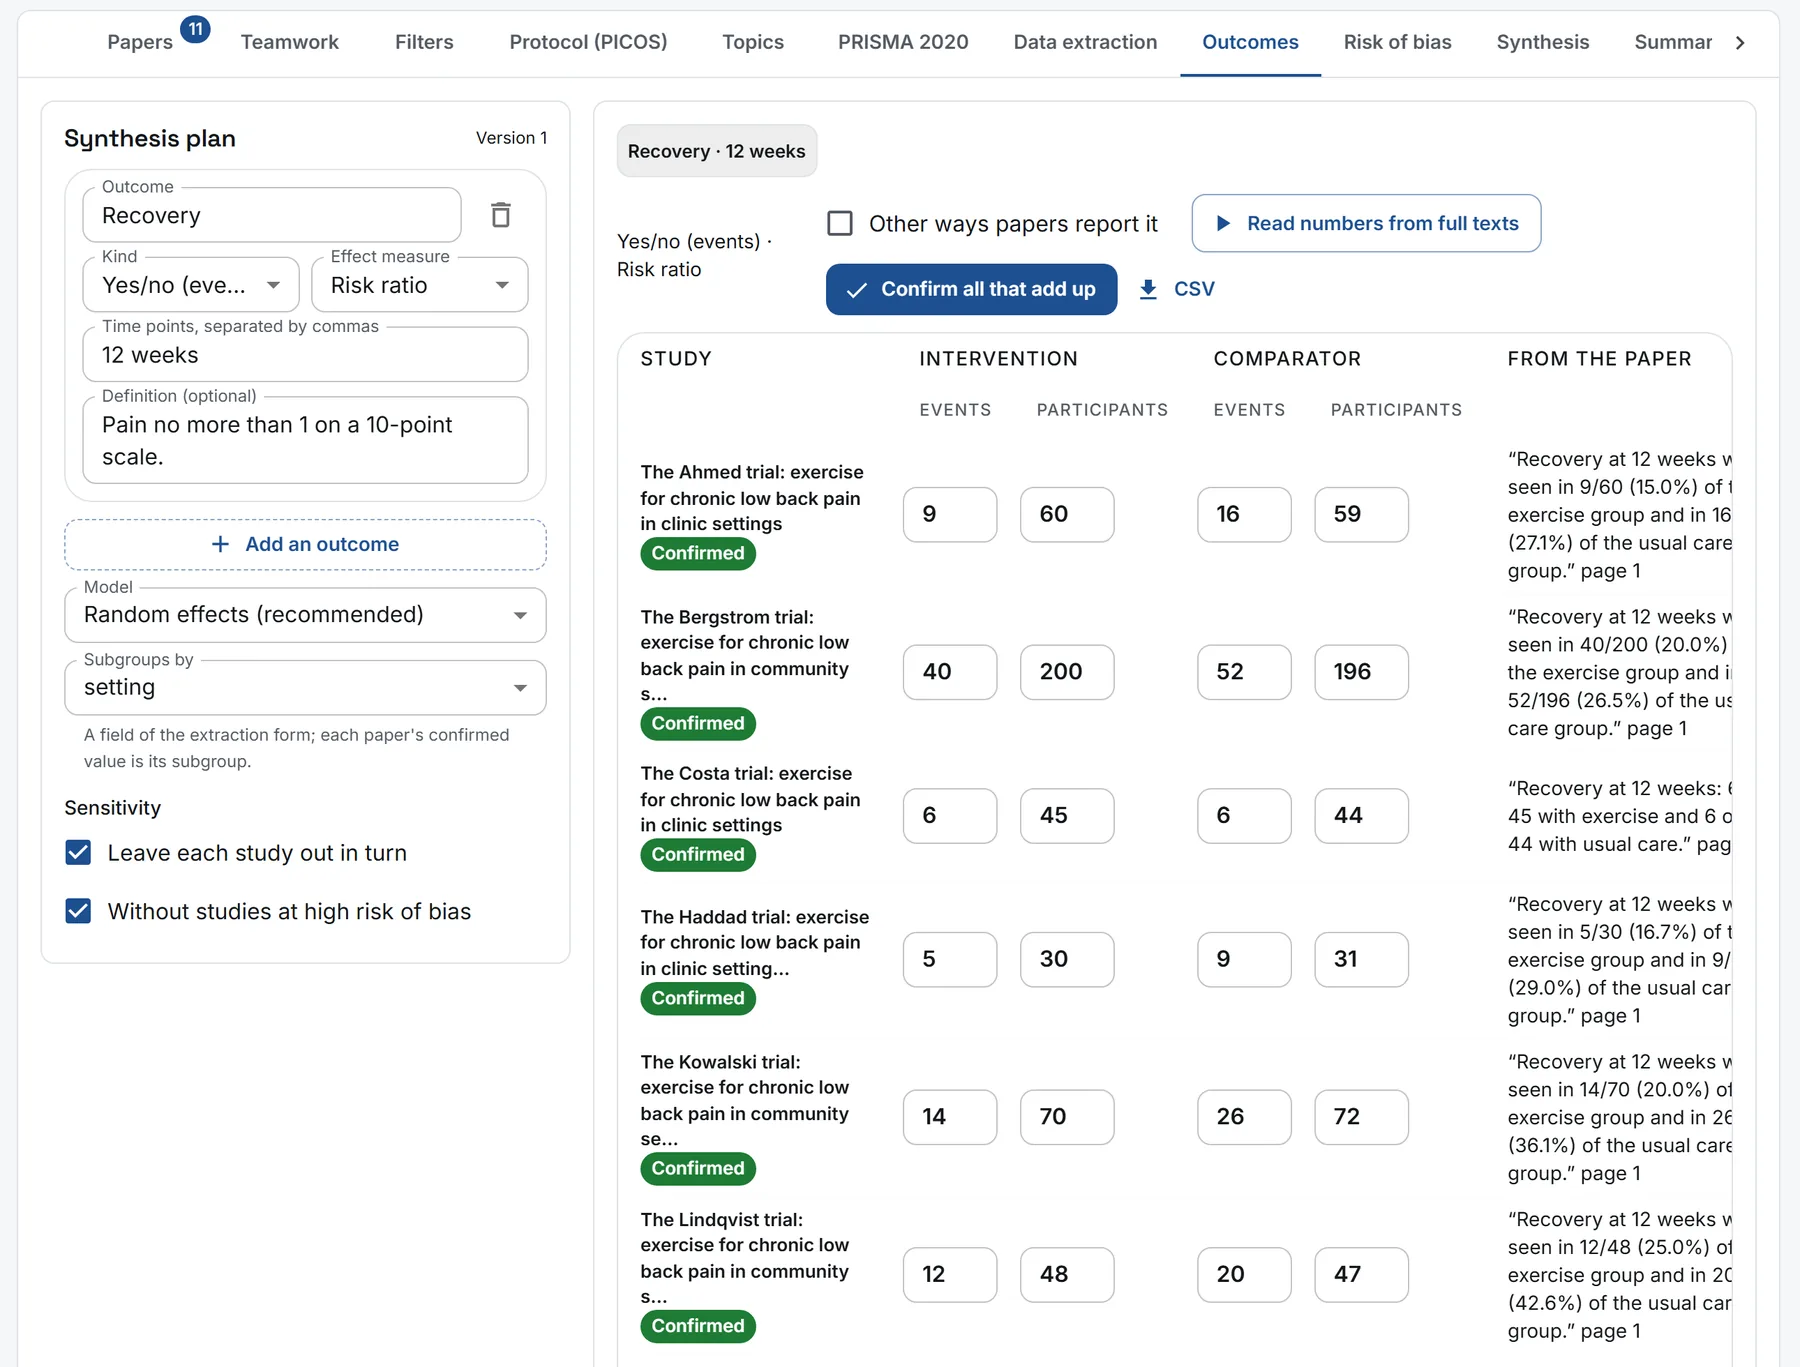
- Plan the synthesis. Add each outcome you will pool: its name, whether it is counted (yes or no, as recovered) or measured (as a pain score), its time points (12 weeks, 1 year) and its effect measure -- risk ratio, odds ratio or risk difference for a counted outcome; mean difference or standardised mean difference for a measured one. Choose random effects (recommended) or a fixed effect, a field of the extraction form whose values form subgroups (such as setting), and the sensitivity analyses. Save the plan; each change is kept as a new version, and the PDF lists them.
- Read the numbers. Read numbers from full texts reads each included paper's PDF for each arm's events and participants, or mean, SD and participants, with the sentence beside them. A count whose percentage is not its own is never suggested. Where a paper gives an SE or a 95% CI instead of an SD, or only its own effect and CI, tick Other ways papers report it.
- Check, then confirm. A number that does not add up is marked: more events than participants, arms adding up to more than the sample size, an estimate outside its CI. Confirm all that add up confirms the rest; correct a number by typing it and pressing the tick. Only confirmed numbers are pooled.
Where extraction has two reviewers, each enters these numbers blind in the Teamwork tab, and the resolver settles any that differ, as for the extraction form's fields.
Then open Synthesis.
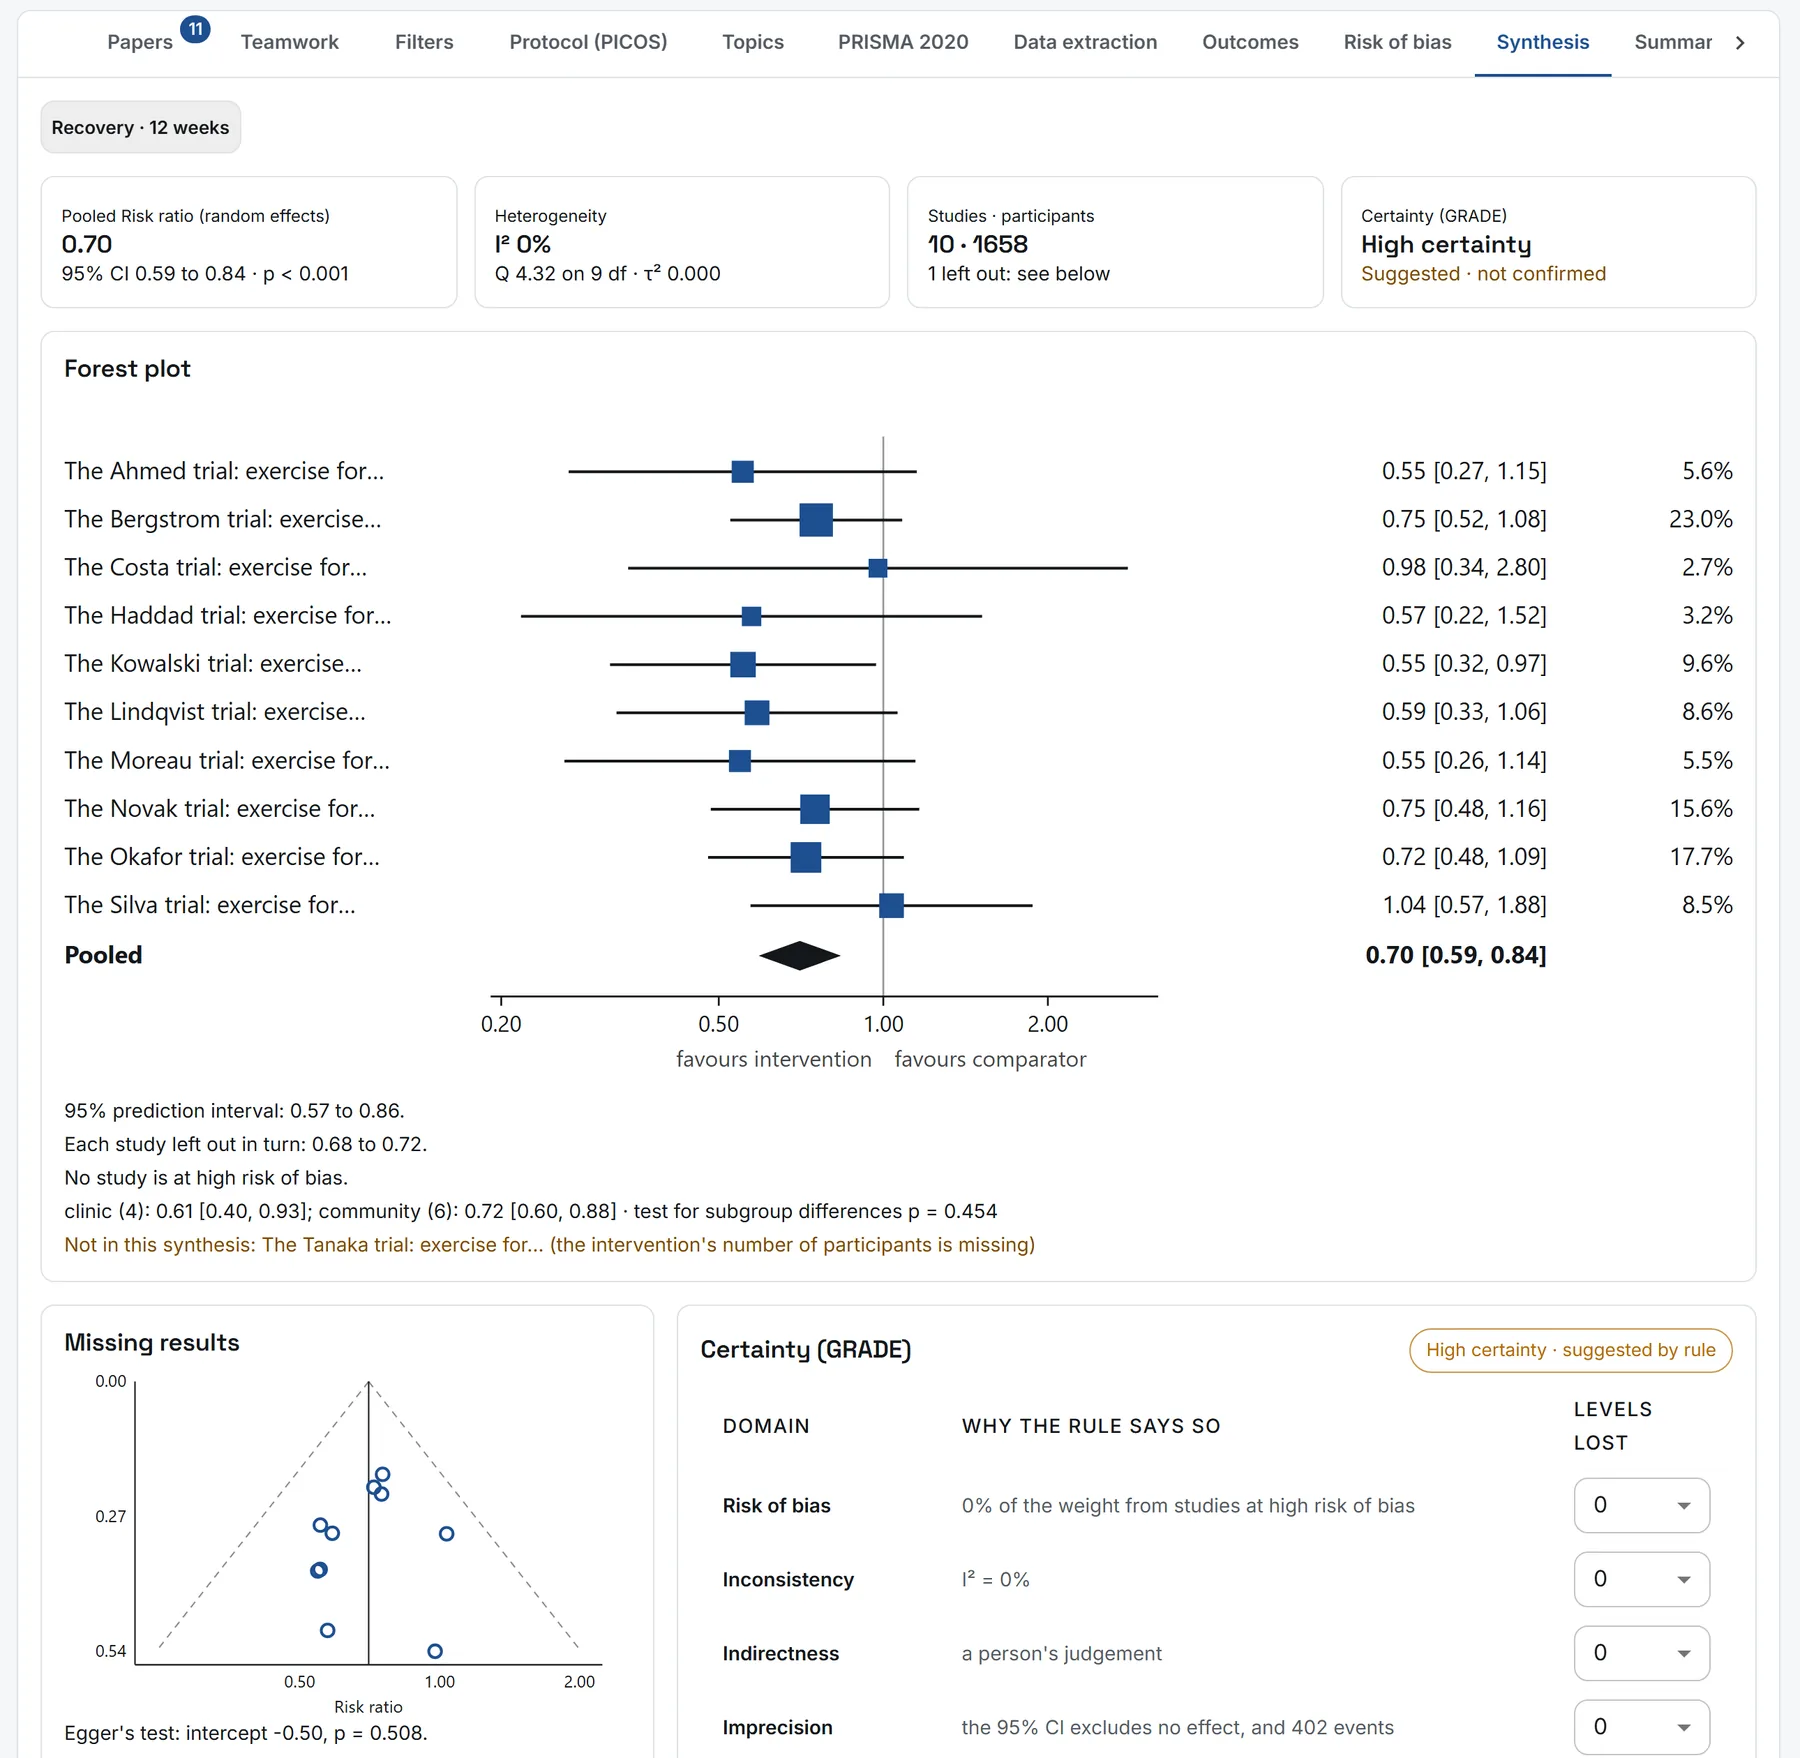
- The pooled effect with its 95% CI, the heterogeneity (I², τ² and Q) and the forest plot: each study a square as large as its weight, the pooled effect a diamond. Beneath it: the prediction interval, each study left out in turn, the studies at high risk of bias left out, the subgroups and their test, and any study left out with why.
- Missing results: from 10 studies, the funnel plot and Egger's test. Judge the risk of bias due to missing results as low, some concerns or high.
- Certainty (GRADE): each domain is suggested by a fixed rule, with its reason -- risk of bias, inconsistency, imprecision, publication bias; indirectness is yours. Change any, then Confirm.
Every figure is worked out by fixed formulas, the ones RevMan and the Cochrane Handbook use, and checked against statsmodels; no model decides anything.